Financial markets are inherently volatile, and investors must continuously balance assessments of upside return potential with downside risk. One of the most critical challenges investors face is drawdown – a temporary decline in portfolio value from its peak. While short-term market fluctuations are common, significant drawdowns can disrupt long-term financial plans, trigger emotional decision-making, and delay wealth accumulation due to the compounding effect of losses. Understanding the causes, impact and management of drawdowns is essential for an investor seeking to minimize risk and maximize long-term returns.
This paper explores the historical context of major market drawdowns, their psychological and financial consequences and practical strategies investors can use to mitigate their effects. By recognizing the patterns and risks associated with drawdowns, investors can develop a more disciplined and resilient approach to investing.
What is drawdown and how is it measured
A drawdown refers to the decline in the value of an investment portfolio from its peak value to its lowest value before a new high is reached. Using historical data, it is typically measured as a percentage change from the trough relative to the previous peak. While it is an important metric for assessing the risk of a strategy, it is often overlooked, possibly because it requires more effort to compute than standard risk measures such as return volatility.
To illustrate, we compute drawdown for the S&P 500 Index using almost a century of annual total return data from 1928-2024.[1]
Exhibit 1: S&P 500 Index’s total returns and drawdowns (1928-2024)
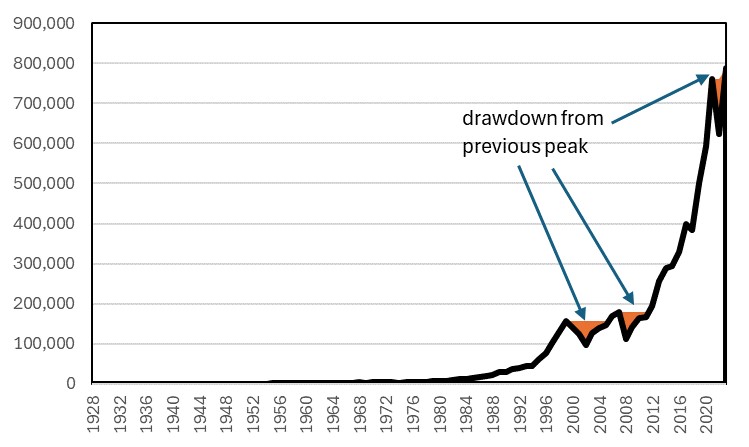
Source: Damodaran dataset, Bank of Singapore.
Exhibit 1 shows the nominal value of USD100 invested in the S&P from 1928 (black line) and the drawdown periods (shaded in orange) over the entire time frame (1928-2024). Earlier drawdowns in the sample are not fully visible in this chart, because of compounding which results in exponentially higher valuations through time that dwarf the magnitude of earlier levels.
Exhibit 2 shows the conventional approach of illustrating drawdowns, with all drawdowns visible: the amplitude (measured along the vertical axis) shows the extent of the drawdown relative to the previous highest level at that point in time, while the span of the shaded area (along the horizontal axis) shows the duration of the full drawdown period (including recovery).
Exhibit 2: S&P 500 Index’s drawdowns (1928-2024, annotated for ease of exposition)
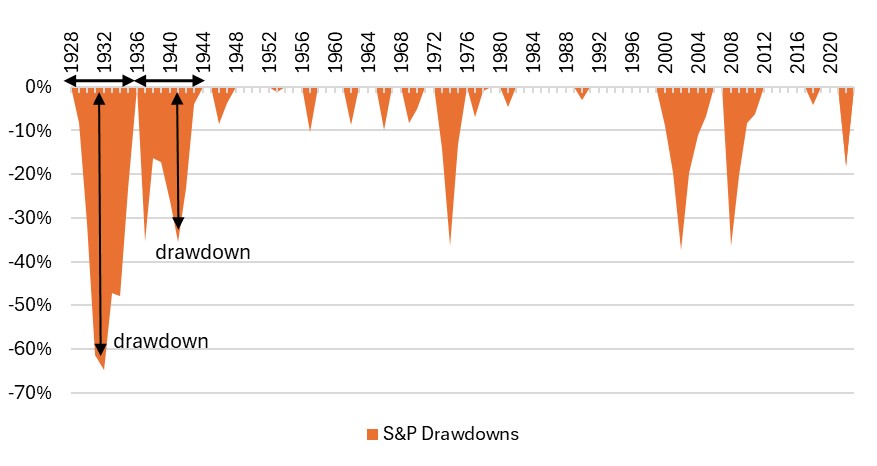
Source: Damodaran dataset, Bank of Singapore.
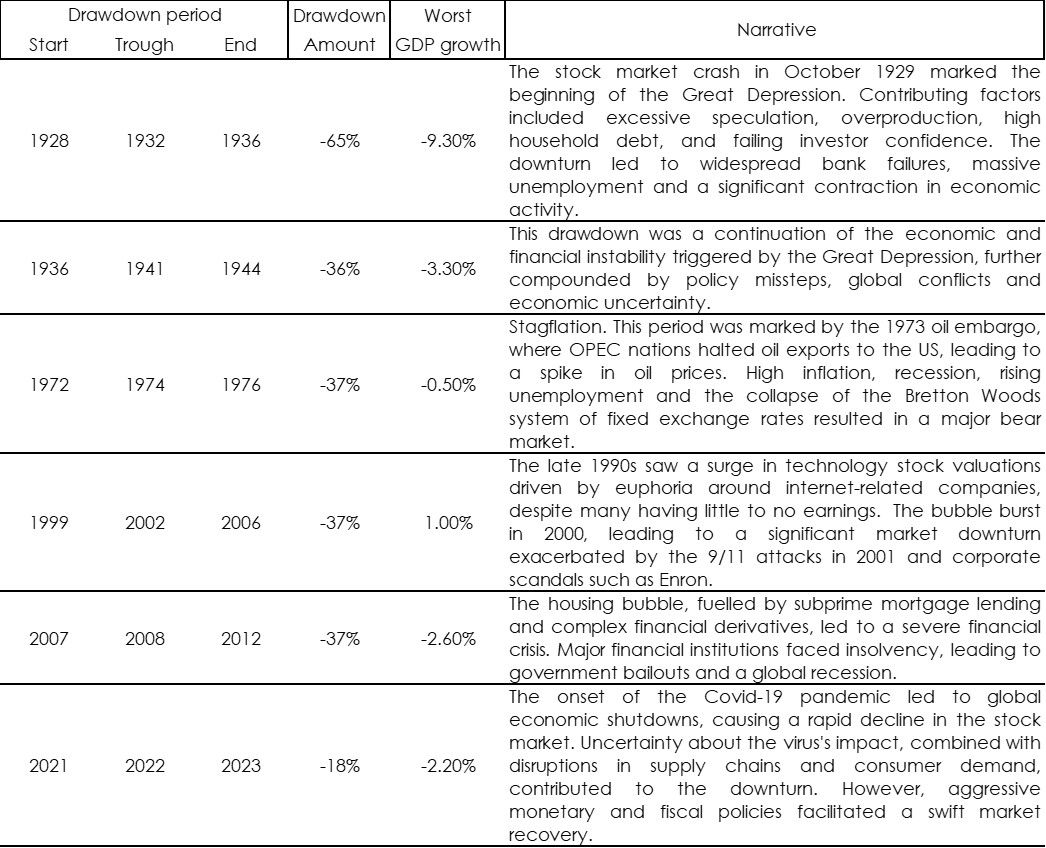
Since 1928, there have been 16 drawdowns in the S&P, 6 larger in magnitude than -15%.[2] Exhibit 3 complements the chart above by summarising the length and depth of S&P drawdowns. Major drawdowns have been caused by a mix of economic crises (e.g., Great Depression, Global Financial Crisis), market speculation and bubbles (e.g., Dot-Com Bubble), external shocks (e.g., Covid-19 pandemic, oil crises). These drawdown episodes have coincided or even contributed to economic contraction or a worsening in economic activity (Appendix 1 gives more detail on the narrative behind the 6 major drawdown episodes).
Drawdown is a crucial risk metric because it quantifies actual losses, which introduce recovery challenges. These challenges include:
Unlike volatility, which measures fluctuations in price which include both upside and downside potential, drawdowns focus specifically on actualized downside risk – how much an investment can decline from its peak before fully recovering. Individual asset classes that exhibit frequent and deep drawdowns may add portfolio risk due to the magnitude required for recovery, but overall portfolio drawdown can be managed using a mix of uncorrelated assets.
Exhibit 3: S&P 500 drawdown and recovery length and magnitude (1928-2024; large drawdowns in bold)
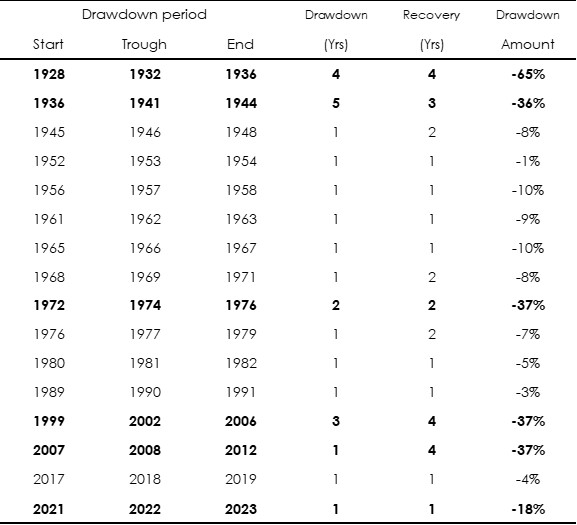
Source: Damodaran dataset, Bank of Singapore.
The Impact of Drawdowns on Investors
Drawdowns can have a significant impact on investors, affecting returns, psychology and investment strategy. Hence, minimizing drawdowns can help to maintain a stable, long-term investment approach. There are several key repercussions on investors:
Returning to Exhibits 2 and 3, we highlight the drawdown for the two worst instances in our sample to illustrate important aspects associated with drawdown costs. During the Great Depression, the drawdown registered in at -65% from the peak (in 1928) to the trough (in 1932). This drawdown episode – from peak to trough to subsequent peak – lasted 8 years until 1936 when a new peak in the value of the S&P portfolio was established. However, this local high was short-lived, and another extended drawdown lasting another 8 years ensued. In this instance, the drawdown was shallower at -35%. During the Great Depression, the value of the S&P portfolio did not recoup its original level in 1928 for a full 16 years!
Let us pause on that for a moment: an investor in the S&P would not have recouped their original investment in 1928 – including dividends being re-invested – until 1944. To regain the first 65% lost, stocks would have needed to return over 180% (as a result of needing to compound at the new lower level) to return to the original pre-drawdown level; and to regain the second round of losses, another 55% in returns was required for a full recovery. This is the classic example of why drawdowns are critical for investors: they disrupt long-term portfolio growth by reducing the capital available for compounding, hence requiring greater returns which (barring a unique sharp recovery such as the post-Covid sell-off and rebound) may take a long time and patience to accumulate to recover losses.
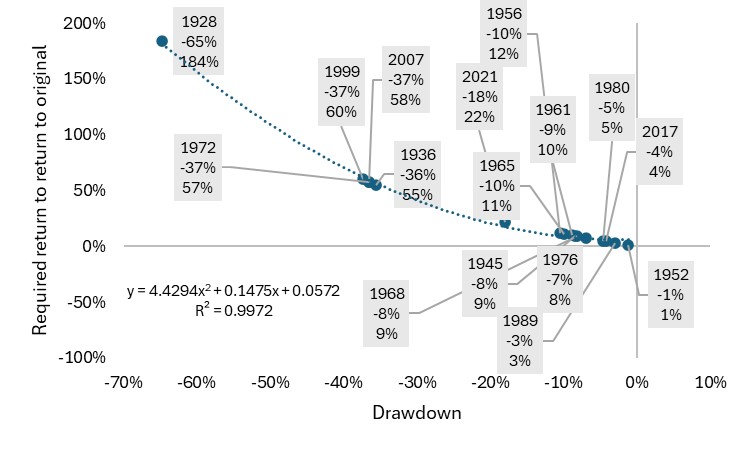
Exhibit 4 charts the relationship between the required return needed to recoup the loss during the S&P drawdown episodes. The relationship is non-linear, with larger drawdowns (such as the 1928 episode of -65%) requiring a quantum more returns (in this case almost 3 times, at 184%) to get back to the pre-drawdown level.
Exhibit 4: S&P 500 Index’s drawdowns and required return to recoup losses (start year of drawdown indicated, 1928-2024)
Source: Damodaran dataset, Bank of Singapore.
Strategies to manage and mitigate drawdowns
Since drawdowns provoke material investment costs, investors should consider employing strategic risk management techniques such as diversification, defensive asset allocation, position sizing, and disciplined portfolio rebalancing to minimize losses and preserve long-term growth potential.
Diversification: By spreading investments across different securities (e.g., industries, geographies, asset classes) diversification reduced the impact of any single asset’s drawdown on the overall portfolio. A well-diversified portfolio can help to smooth returns and provide stability during market downturns. The S&P 500 Index, for example, as an index of 500 large cap stocks, is already more diversified than an investment in any one stock.
The following chart and table show the drawdowns and key performance metrics for a random sample of US stocks (chosen for the availability of their total return data since 1970 in order to capture multiple drawdown periods): Coco Cola (KO), General Electric (GE), and International Business Machines (IBM), as well as for the S&P Index. The diversified constituents of the S&P 500 Index results in lower volatility as well as shallower average drawdown than any single stock in the sample.
Exhibit 5: Individual stocks and S&P 500 Index drawdowns (1970-2024)
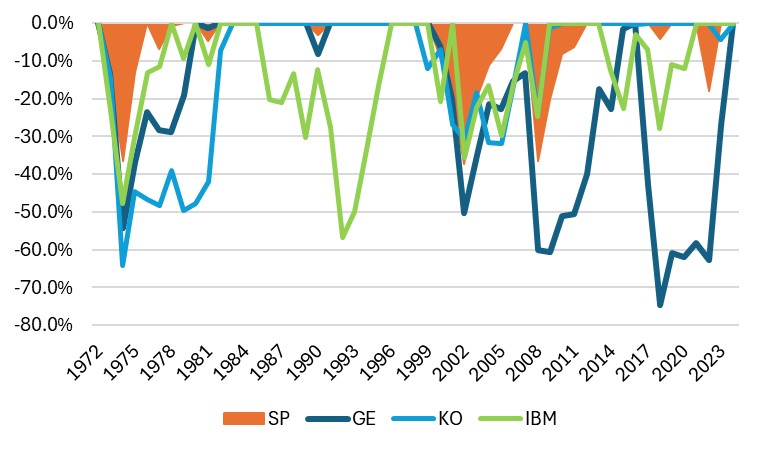
Source: Bloomberg, Damodaran dataset, Bank of Singapore.
Exhibit 6: Individual stocks and S&P 500 Index return and selected risk metrics (1970-2024)
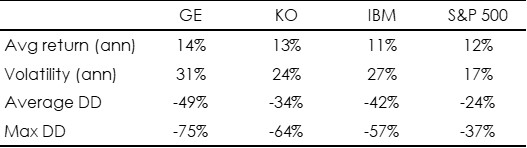
Source: Bloomberg, Damodaran dataset, Bank of Singapore.
Defensive asset allocation: Allocating a portion of the portfolio to lower-risk assets like bonds (Bonds remain a perennial diversifier), or countercyclical assets like gold (Gold Revisited) or acyclical assets like defensive stocks can help cushion losses during broad risk-off episodes. This strategy ensures that when riskier assets experience drawdowns, more stable investments provide balance and limit overall losses.
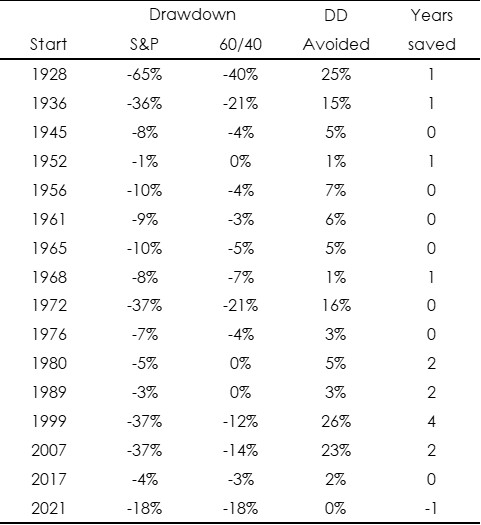
Exhibit 7 summarises the drawdowns from 100% invested in the S&P vs a balanced portfolio of 60% in stocks and 40% in bonds. The penultimate and final columns show the drawdown averted in terms of performance and years saved. For example, a 60-40 portfolio in 1999 would have drawndown 12% vs 27% for a 100% allocation in US equities, hence trimming the cumulative loss by 26ppts, and saving 4 years of time spent in drawdown and recovery.
Drawdown mitigation is not without cost: the average returns for 60-40 portfolios since 1928 is 9%, vs 11.8% for S&P. The exact balance of risk and return will be specific to investor risk preference, as we have described in “Uncertainty in the formation of expectations”. Delving deeper into the different risk characteristics of bonds vs stocks, Appendix 2 takes a return and risk-holistic approach to these two asset classes.
Exhibit 7: S&P 500 Index vs a portfolio of 60% S&P+40% UST drawdowns, comparing the drawdown and time averted (1928-2024)
Source: Damodaran dataset, Bank of Singapore.
Position sizing: Carefully deciding how much capital to allocate to each investment prevents excessive exposure to any single asset. By limiting the size of positions in high-risk investments, investors can reduce the severity of drawdowns and maintain portfolio stability.
Disciplined portfolio rebalancing: Rebalancing ensures that investors maintain the intended asset allocation by selling assets that have increased in value and reallocating to those that have declined. While this means buying assets that are in a drawdown, the key is to do so in a risk-controlled manner – avoiding overexposure while benefitting from potential recoveries. This strategy prevents an unintentional shift towards safer assets at the expense of long-term growth potential.
Long-term perspective: One of the most effective strategies to managing drawdowns is maintaining a long-term investment mindset that stresses fundamentals, earnings, growth and economic trends, and avoiding reactionary decisions based on short-term market movements. Patience and position management can lead to better outcomes: investments grow through compounding returns, meaning that time in the market is more important than timing the market; in our next primer we will go into this in some detail!
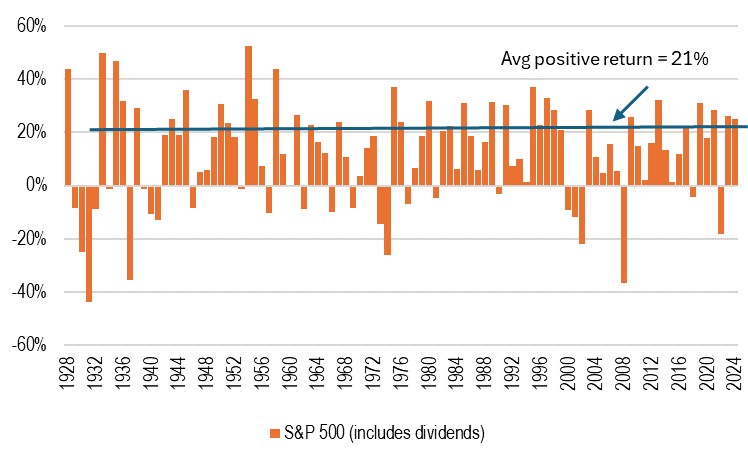
Fear and panic can drive impulsive and sub-optimal decisions, such as selling at the bottom, forgoing the recovery phase, wherein historically in the case of the S&P, most above-average positive returns are concentrated within a period (see Exhibit 8). Having a pre-defined risk management strategy (comprised of all or a combination of the above elements) and staying focused on the fundamentals that underlie investment valuations can help investors stay disciplined.
Exhibit 8: S&P 500 annual returns (1928-2024)
Source: Damodaran dataset, Bank of Singapore.
Implications for investors
Appendix 1: Causes of Major S&P 500 Index Drawdowns in History
Major drawdowns have been caused by a mix of economic crises (e.g., Great Depression, Global Financial Crisis), market speculation and bubbles (e.g., Dot-Com Bubble), external shocks (e.g., Covid-19 pandemic, oil crises). Generally, drawdown episodes coincided with economic contraction or a worsening in economic activity.
Source: Bloomberg, Damodaran, Bank of Singapore.
Appendix 2: Comparing S&P and UST performances using returns, drawdowns and other risk metrics
S&P 500 Index and 10Y US Treasury bond drawdowns (1928-2024)
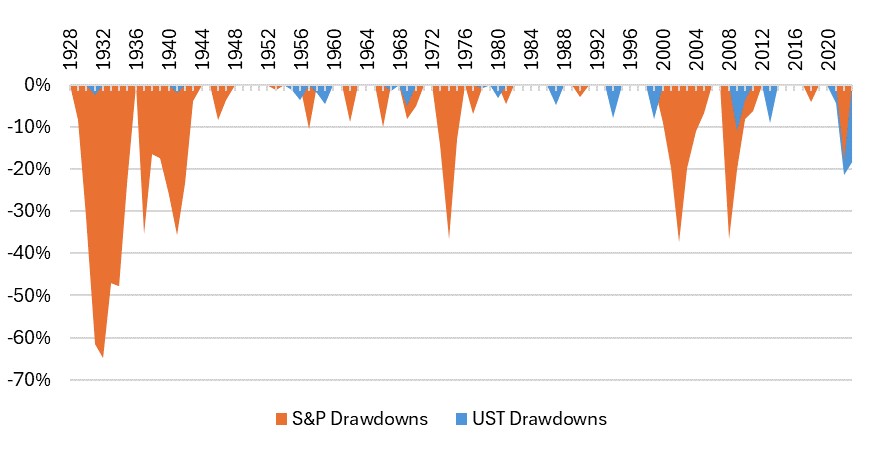
Source: Damodaran, Bank of Singapore.
The above shows the conventional approach of illustrating drawdowns: the orange areas show peak to trough to subsequent peak performance for the S&P, while blue areas show the same for 10Y US Treasuries (UST).
A few points worth noting in comparing the S&P vs UST drawdowns.
The relatively higher risk of equities vs bonds using drawdown measures is consistent with other measures of risk, as summarised in the table in the following page.
The usual approach evaluating investments is to assess historical average return and the volatility of returns.
S&P 500 and 10Y UST returns and risk metrics (calculated using annual data, 1928-2024)
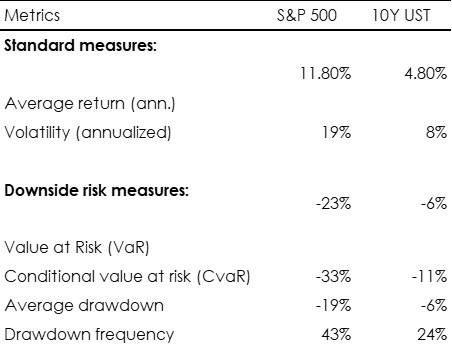
Source: Damodaran, Bank of Singapore.
Volatility gives a sense of the probable range of upside and downside performance. But there are ways to obtain a better approximation of downside risk, or the risk of loss, which is the risk investors worry about. The following risk metrics provide more detailed measures of how the asset classes have behaved in negative outcomes:
How various risk metrics work together in risk analysis
[1] In this study, we chose the data source to obtain as long a timeseries as possible. Our data comes from Professor Aswath Damodaran’s site, housed in NYU Stern School; it serves as a standard in academia:
(http://www.stern.nyu.edu/~adamodar/New_Home_Page/data.html). Only annual data is available, and so our computations may differ from those which use monthly or higher frequency data, and use rolling windows to obtain annualized or other cumulative data.
[2] An arbitrary threshold I have chosen to demarcate significant losses; these tend to also correspond with full drawdown episodes 4 or more years in length.
Disclaimers and Disclosures
This material is prepared by Bank of Singapore Limited (Co Reg. No.: 197700866R) (the “Bank”) and is distributed in Singapore by the Bank.
This material does not provide individually tailored investment advice. This material has been prepared for and is intended for general circulation. The contents of this material does not take into account the specific investment objectives, investment experience, financial situation, or particular needs of any particular person. You should independently evaluate the contents of this material, and consider the suitability of any product discussed in this material, taking into account your own specific investment objectives, investment experience, financial situation and particular needs. If in doubt about the contents of this material or the suitability of any product discussed in this material, you should obtain independent financial advice from your own financial or other professional advisers, taking into account your specific investment objectives, investment experience, financial situation and particular needs, before making a commitment to purchase any product.
This material is not and should not be construed, by itself, as an offer or a solicitation to deal in any product or to enter into any legal relations. You should contact your own licensed representative directly if you are interested in buying or selling any product discussed in this material.
This material is not intended for distribution, publication or use by any person in any jurisdiction outside Singapore, Hong Kong or such other jurisdiction as the Bank may determine in its absolute discretion, where such distribution, publication or use would be contrary to applicable law or would subject the Bank or its related corporations, connected persons, associated persons or affiliates (collectively “Affiliates”) to any licensing, registration or other requirements in such jurisdiction.
The Bank and its Affiliates may have issued other reports, analyses, or other documents expressing views different from the contents of this material, and may provide other advice or make investment decisions that are contrary to the views expressed in this material, and all views expressed in all reports, analyses and documents are subject to change without notice. The Bank and its Affiliates reserve the right to act upon or use the contents of this material at any time, including before its publication.
The author of this material may have discussed the information or views contained in this material with others within or outside the Bank, and the author or such other Bank employees may have already acted on the basis of such information or views (including communicating such information or views to other customers of the Bank).
The Bank, its employees (including those with whom the author may have consulted in the preparation of this material))and discretionary accounts managed by the Bank may have long or short positions (including positions that may be different from or opposing to the views in this material or may be otherwise interested in any of the product(s) (including derivatives thereof) discussed in material, may have acquired such positions at prices and market conditions that are no longer available, may from time to time deal in such product(s) and may have interests different from or adverse to your interests.
Analyst Declaration
The analyst(s) who prepared this material certifies that the opinions contained herein accurately and exclusively reflect his or her views about the securities of the company(ies) and that he or she has taken reasonable care to maintain independence and objectivity in respect of the opinions herein.
The analyst(s) who prepared this material and his/her associates do not have financial interests in the company(ies). Financial interests refer to investments in securities, warrants and/or other derivatives. The analyst(s) receives compensation based on the overall revenues of Bank of Singapore Limited, and no part of his or her compensation was, is, or will be directly or indirectly related to the inclusion of specific recommendations or views in this material. The reporting line of the analyst(s) is separate from and independent of the business solicitation or marketing departments of Bank of Singapore Limited.
The analyst(s) and his/her associates confirm that they do not serve as directors or officers of the company(ies) and the company(ies)or other third parties have not provided or agreed to provide any compensation or other benefits to the analyst(s) in connection with this material.
An “associate” is defined as (i) the spouse, parent or step-parent, or any minor child (natural or adopted) or minor step-child, or any sibling or step-sibling of the analyst; (ii) the trustee of a trust of which the analyst, his spouse, parent or step-parent, minor child (natural or adopted) or minor step-child, or sibling or step-sibling is a beneficiary or discretionary object; or (iii) another person accustomed or obliged to act in accordance with the directions or instructions of the analyst.
Conflict of Interest Declaration
The Bank is a licensed bank regulated by the Monetary Authority of Singapore in Singapore. Bank of Singapore Limited, Hong Kong Branch (incorporated in Singapore with limited liability), is an Authorized Institution as defined in the Banking Ordinance of Hong Kong (Cap 155), regulated by the Hong Kong Monetary Authority in Hong Kong and a Registered Institution as defined in the Securities and Futures Ordinance of Hong Kong (Cap.571) regulated by the Securities and Futures Commission in Hong Kong. The Bank, its employees and discretionary accounts managed by its Singapore Office/Hong Kong Office may have long or short positions or may be otherwise interested in any of the investment products (including derivatives thereof) referred to in this document and may from time to time dispose of any such investment products. The Bank forms part of the OCBC Group (being for this purpose Oversea-Chinese Banking Corporation Limited (“OCBC Bank”) and its subsidiaries, related and affiliated companies). OCBC Group, their respective directors and/or employees (collectively “Related Persons”) may have interests in the investment products or the issuers mentioned herein. Such interests include effecting transactions in such investment products, and providing broking, investment banking and other financial services to such issuers. OCBC Group and its Related Persons may also be related to, and receive fees from, providers of such investment products. There may be conflicts of interest between OCBC Bank, the Bank, OCBC Investment Research Private Limited, OCBC Securities Private Limited or other members of the OCBC Group and any of the persons or entities mentioned in this report of which the Bank and its analyst(s) are not aware due to OCBC Bank’s Chinese Wall arrangement.
The Bank adheres to a group policy (as revised and updated from time to time) that provides how entities in the OCBC Group manage or eliminate any actual or potential conflicts of interest which may impact the impartiality of research reports issued by any research analyst in the OCBC Group.
If this material pertains to an offer, it may only be offered (i) in Hong Kong, to qualified Private Banking Customers and Professional Investors (as defined under the Securities and Futures Ordinance); (ii) in Singapore, to Accredited Investors (as defined under the Securities and Futures Act 2001); and (iii) in the Dubai International Financial Center, to Professional Clients (as defined under the Dubai Financial Services Authority rules). No other persons may act on the contents of the material.
Other Disclosures
Singapore
Where this material relates to structured deposits, this clause applies:
The product is a structured deposit. Structured deposits are not insured by the Singapore Deposit Insurance Corporation. Unlike traditional deposits, structured deposits have an investment element and returns may vary. You may wish to seek independent advice from a financial adviser before making a commitment to purchase this product. In the event that you choose not to seek independent advice from a financial adviser, you should carefully consider whether this product is suitable for you.
Where this material relates to dual currency investments, this clause applies:
The product is a dual currency investment. A dual currency investment product (“DCI”) is a derivative product or structured product with derivatives embedded in it. A DCI involves a currency option which confers on the deposit-taking institution the right to repay the principal sum at maturity in either the base or alternate currency. Part or all of the interest earned on this investment represents the premium on this option.
By purchasing this DCI, you are giving the issuer of this product the right to repay you at a future date in an alternate currency that is different from the currency in which your initial investment was made, regardless of whether you wish to be repaid in this currency at that time. DCIs are subject to foreign exchange fluctuations which may affect the return of your investment. Exchange controls may also be applicable to the currencies your investment is linked to. You may incur a loss on your principal sum in comparison with the base amount initially invested. You may wish to seek advice from a financial adviser before making a commitment to purchase this product. In the event that you choose not to seek advice from a financial adviser, you should carefully consider whether this product is suitable for you.
Hong Kong
This document has not been delivered for registration to the Registrar of Companies in Hong Kong and its contents have not been reviewed by any regulatory authority in Hong Kong. Accordingly: (i) the shares/notes may not be offered or sold in Hong Kong by means of any document other than to persons who are "Professional Investors" within the meaning of the Securities and Futures Ordinance (Cap. 571) of Hong Kong and the Securities and Futures (Professional Investor) Rules made thereunder or in other circumstances which do not result in the document being a "prospectus" within the meaning of the Companies (Winding Up and Miscellaneous Provisions) Ordinance (Cap. 32) of Hong Kong or which do not constitute an offer to the public within the meaning of the Companies (Winding Up and Miscellaneous Provisions) Ordinance; and (ii) no person may issue any invitation, advertisement or other document relating to the shares/notes whether in Hong Kong or elsewhere, which is directed at, or the contents of which are likely to be accessed or read by, the public in Hong Kong (except if permitted to do so under the securities laws of Hong Kong) other than with respect to the shares/notes which are or are intended to be disposed of only to persons outside Hong Kong or only to "Professional Investors" within the meaning of the Securities and Futures Ordinance and the Securities and Futures (Professional Investor) Rules made thereunder.
The product may involve derivatives. Do not invest in it unless you fully understand and are willing to assume the risks associated with it. If you have any doubt, you should seek independent professional financial, tax and/or legal advice as you deem necessary.
Where this material relates to a Complex Product, this clause applies:
Warning Statement and Information about Complex Product
(Applicable to accounts managed by Hong Kong Relationship Manager)
Where this material relates to a Complex Product – funds and ETFs, this clause applies additionally:
Where this material relates to a Complex Product (Options and its variants, Swap and its variants, Accumulator and its variants, Reverse Accumulator and its variants, Forwards), this clause applies additionally:
Where this material relates to a Loss Absorption Product, this clause applies:
Warning Statement and Information about Loss Absorption Products
(Applicable to accounts managed by Hong Kong Relationship Manager)
Before you invest in any Loss Absorption Product (as defined by the Hong Kong Monetary Authority), please read and ensure that you understand the features of a Loss Absorption Product, which may generally have the following features:
Where this material relates to a certificate of deposit, this clause applies:
It is not a protected deposit and is not protected by the Deposit Protection Scheme in Hong Kong.
Where this material relates to a structured deposit, this clause applies:
It is not a protected deposit and is not protected by the Deposit Protection Scheme in Hong Kong.
Where this material relates to a structured product, this clause applies:
This is a structured product which involves derivatives. Do not invest in it unless you fully understand and are willing to assume the risks associated with it. If you are in any doubt about the risks involved in the product, you may clarify with the intermediary or seek independent professional advice.
Dubai International Financial Center
Where this material relates to structured products and bonds, this clause applies:
The Distributor represents and agrees that it has not offered and will not offer the product to any person in the Dubai International Financial Centre unless such offer is an “Exempt Offer” in accordance with the Market Rules of the Dubai Financial Services Authority (the “DFSA”).
The DFSA has no responsibility for reviewing or verifying any documents in connection with Exempt Offers.
The DFSA has not approved the Information Memorandum or taken steps to verify the information set out in it, and has no responsibility for it.
The product to which this document relates may be illiquid and/or subject to restrictions in respect of their resale. Prospective purchasers of the products offered should conduct their own due diligence on the products.
Please make sure that you understand the contents of the relevant offering documents (including but not limited to the Information Memorandum or Offering Circular) and the terms set out in this document. If you do not understand the contents of the relevant offering documents and the terms set out in this document, you should consult an authorised financial adviser as you deem necessary, before you decide whether or not to invest.
Where this material relates to a fund, this clause applies:
This Fund is not subject to any form of regulation or approval by the Dubai Financial Services Authority (“DFSA”). The DFSA has no responsibility for reviewing or verifying any Prospectus or other documents in connection with this Fund. Accordingly, the DFSA has not approved the Prospectus or any other associated documents nor taken any steps to verify the information set out in the Prospectus, and has no responsibility for it. The Units to which this Fund relates may be illiquid and/or subject to restrictions on their resale. Prospective purchasers should conduct their own due diligence on the Units. If you do not understand the contents of this document you should consult an authorized financial adviser. Please note that this offer is intended for only Professional Clients and is not directed at Retail Clients.
These are also available for inspection, during normal business hours, at the following location:
Bank of Singapore
Office 30-34 Level 28
Central Park Tower
DIFC, Dubai
U.A.E
Cross Border Disclaimer and Disclosures
Refer to https://www.bankofsingapore.com/Disclaimers_and_Disclosures.html for cross-border marketing disclaimers and disclosures.