
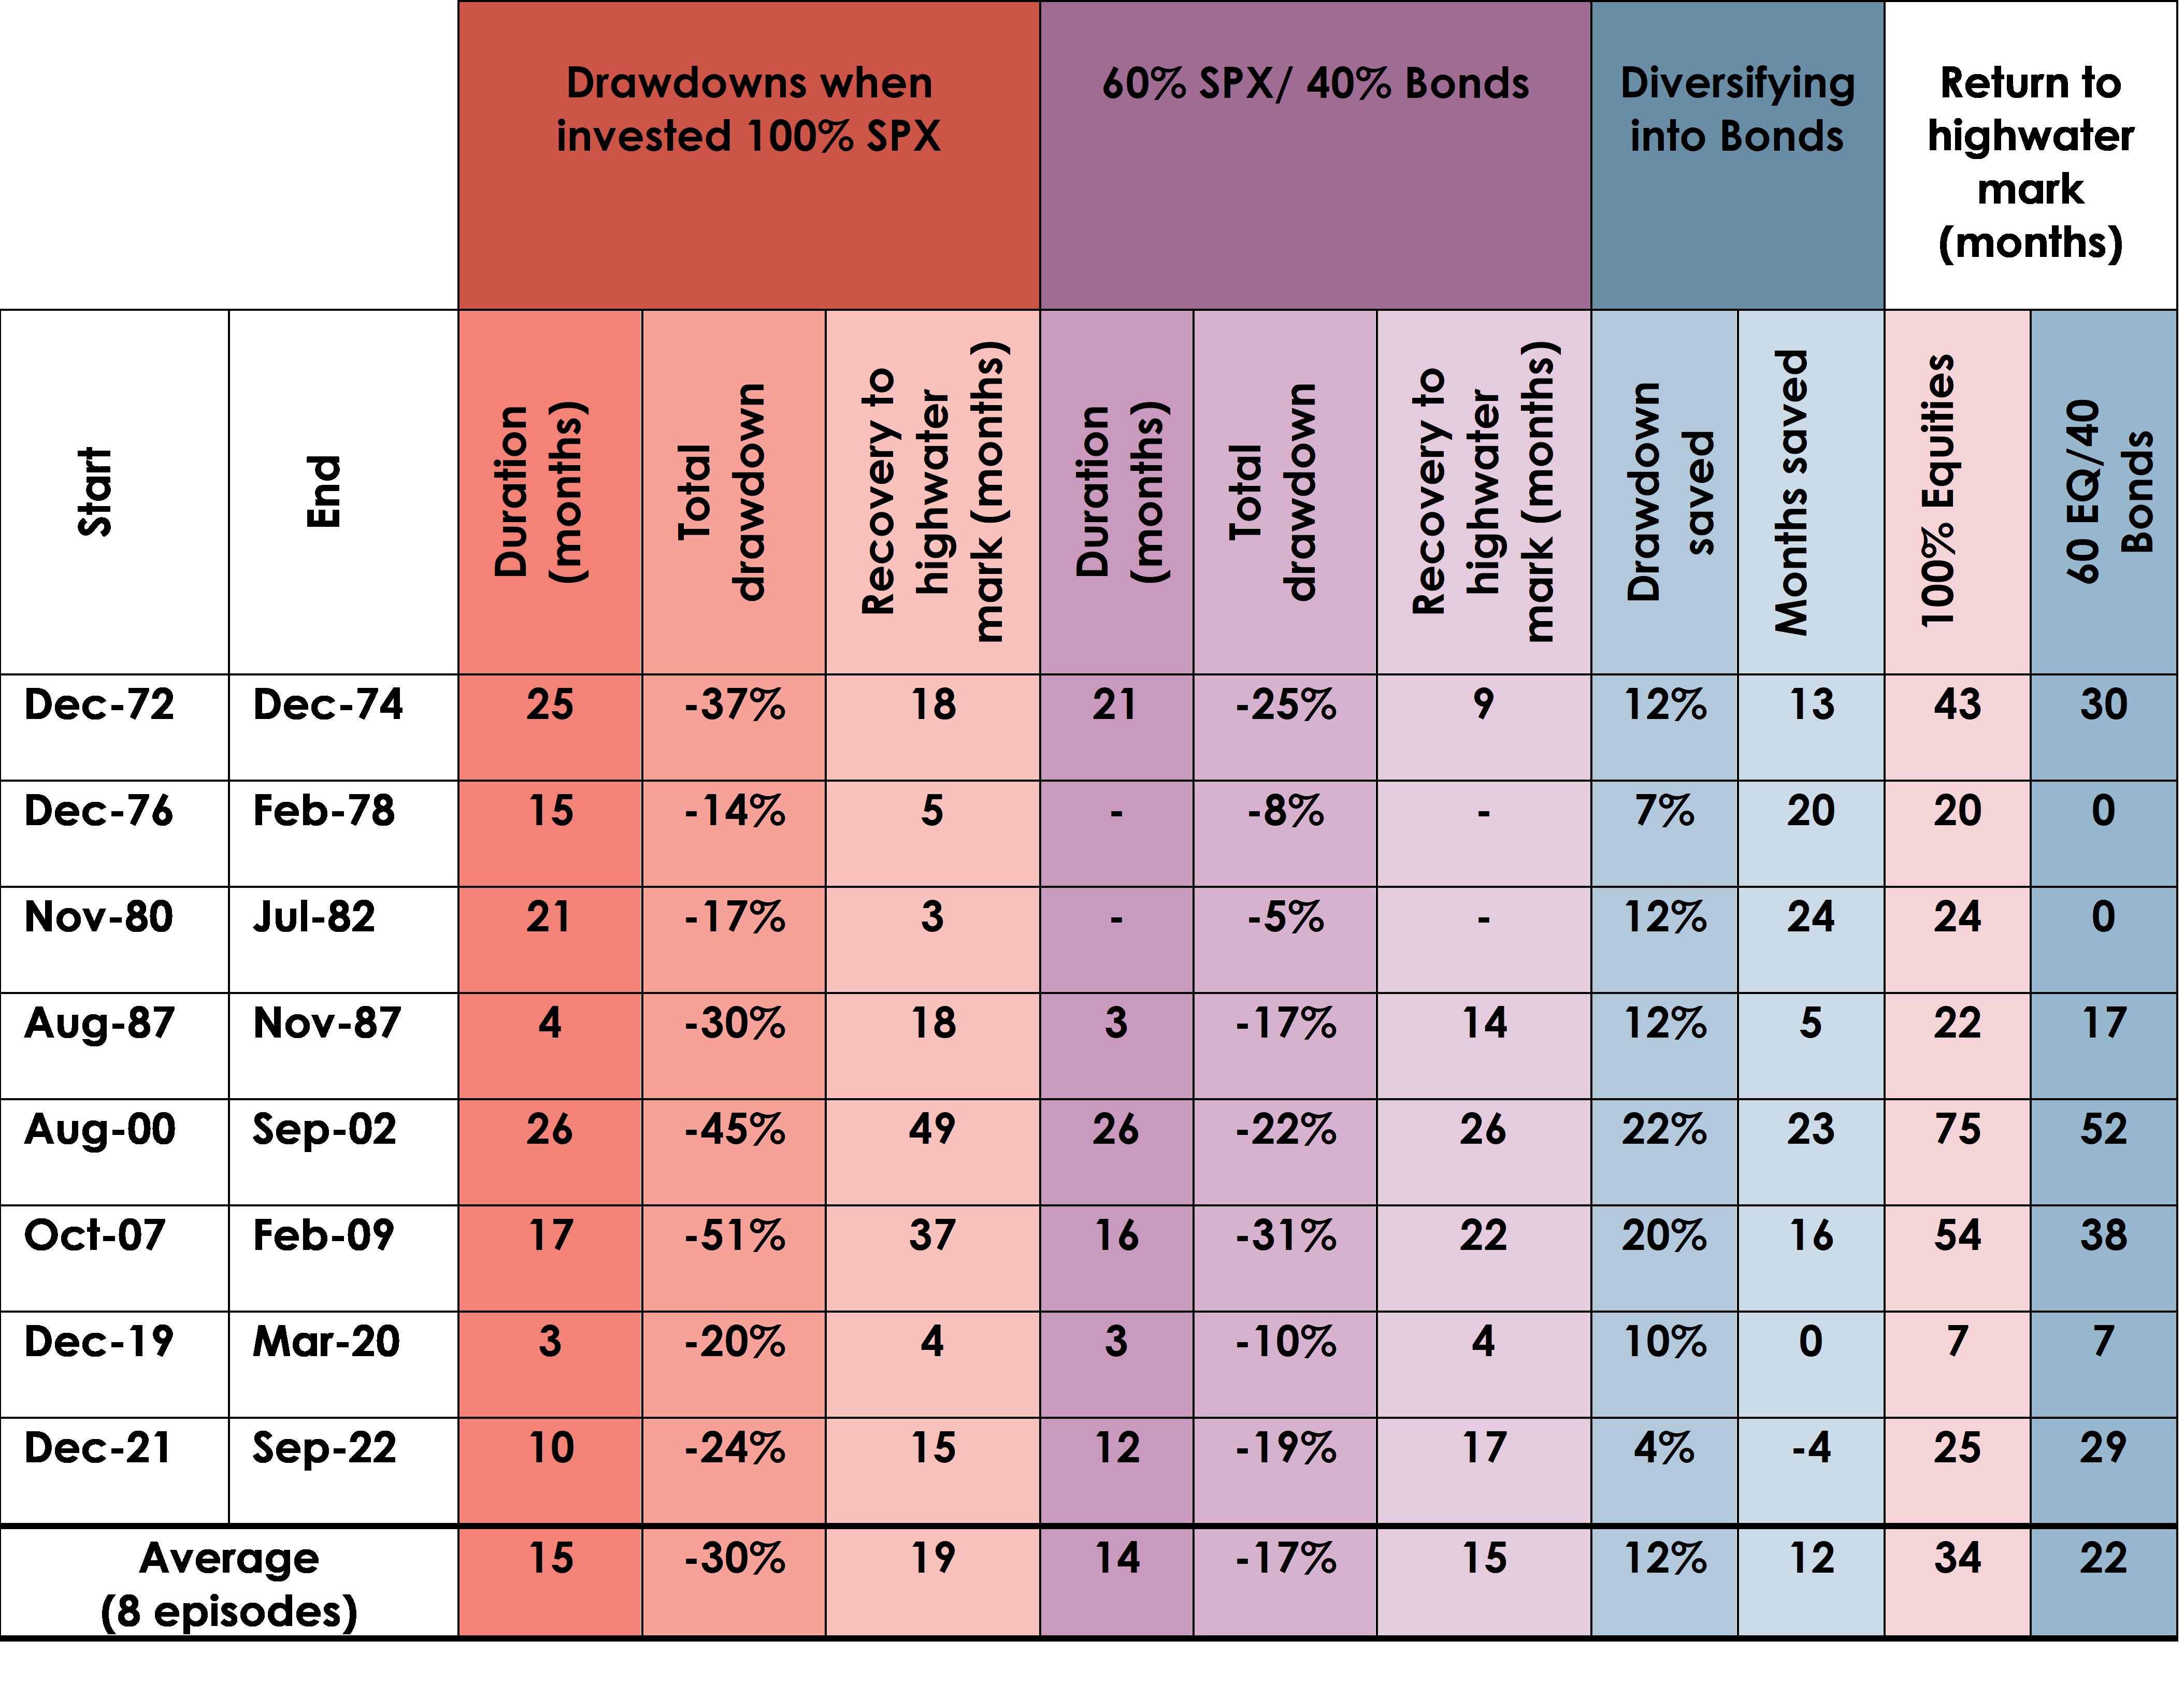
The credibility of UST as a diversifier against large US equity drawdowns has been severely dented since their failure to meaningfully hedge the S&P 500 Index selloff in 2022. Investors depend on bonds to achieve a balanced and resilient investment strategy, by offering a predictable source of income and capital preservation while diversifying equity risk and economic downturns. But in 2022, during one of the steepest equity drawdowns in memory, bonds failed in their role as an equity hedge: from its peak in Dec 2021 to its trough in Sep 2022, the S&P 500 Index lost 24%, while a balanced portfolio 60% in equities and 40% in bonds lost 19% - less damage, but not by much.
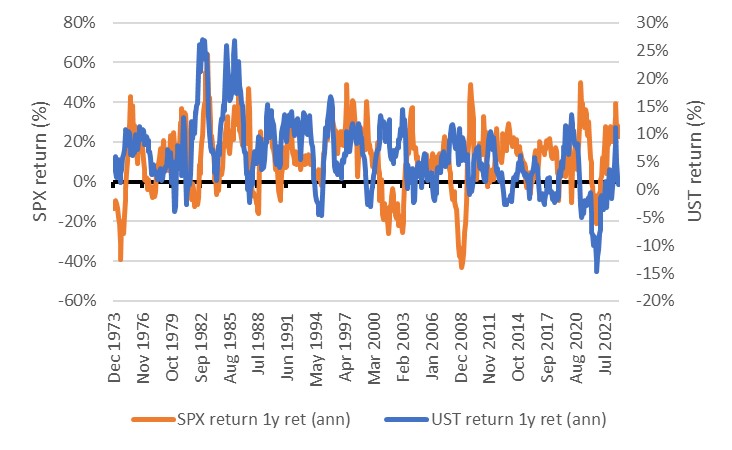
Exhibit 1: Time series of rolling 12m returns: SPX and UST (1973-2024)
Source: Bloomberg, Bank of Singapore.
In previous US equity drawdowns, the same allocation to bonds would have easily cut the drawdown loss by half, thereby speeding up the return to the previous high-water mark by an average of 14 months. 2022 was aberrant: not only did bonds barely mitigate the equity loss, but the return to the high-water mark for a balanced portfolio took longer than for a portfolio 100% in US equities (See Appendix).
What happened? Can investors still rely on UST as a hedge for their risk exposure? We think that bonds not only provide a ballast to a diversified portfolio, but continue to serve as a useful hedge to equity risk, in most circumstances, and especially over longer holding periods.
Exhibit 1 shows the rolling 12m return for USTs and the SPX over the last 50 years (note the two different axes). It clearly shows negative performance in 2022 for both, with the bond performance of -15% over a 12m period, which was the worst in its history. However, in other instances when US equities collapsed, positive bond returns prevailed: the 1973 stagflation, the early 2000s recession and bursting of the dot-com bubble, and notably the Global Financial Crisis in 2008-2009 were all examples of bonds well positioned to hedge such major equity drawdowns.
Just how rare was 2022? The answer is: very.
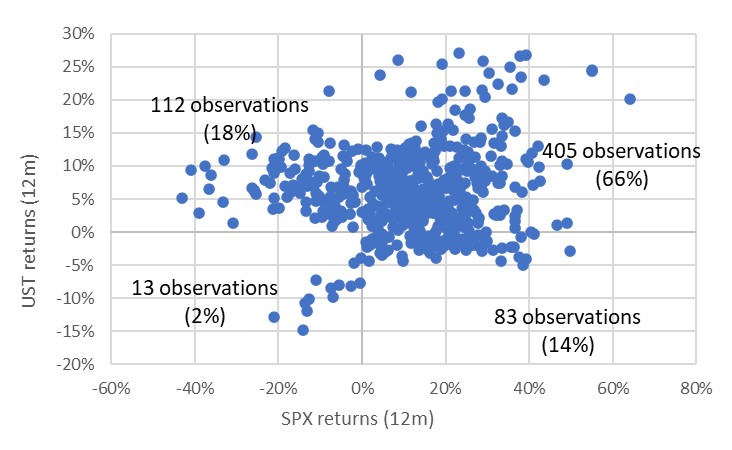
Exhibit 2 shows the same rolling 12m return data as above, but as a scatter plot of S&P 500 Index returns on the horizontal axis and UST returns on the vertical.
Exhibit 2: Scatter plot of rolling 12m returns: SPX and UST (monthly,1973-2024)
Source: Bloomberg, Bank of Singapore.
There are a total of 613 observations using monthly data from 1973-2024. Since our focus is how bonds perform when equity returns are negative, we focus on the data points to the left of the vertical axis, which represent instances when 12m equity returns were negative; this is 20% of the overall sample. Of these, only 13 observations (or a mere 2% of the total sample) represent episodes when both equity and bond returns have been negative.
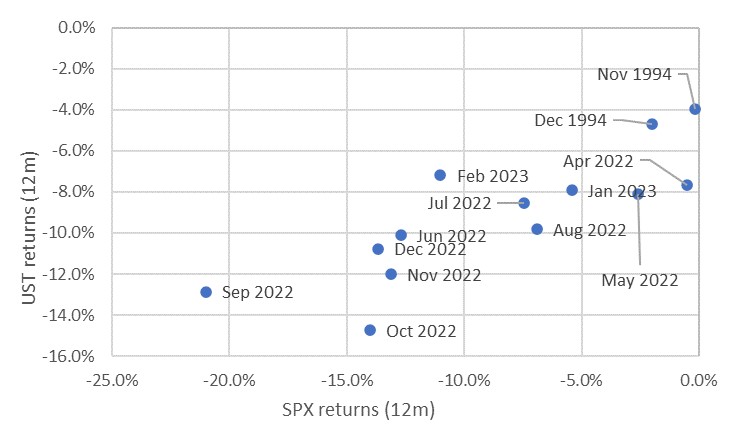
Exhibit 3 telescopes into the unusual instances when equities and bonds both declined in value (i.e., the bottom left quadrant of the chart) and highlights when they occurred. Most episodes occurred in the 2022 period (for instance, the 12 months ending on 31 Oct 2022, is when UST experienced their worst performance of almost -15%).
Exhibit 3: Scatter plot of rolling 12m returns: SPX and UST when both are negative (monthly,1973-2024)
Source: Bloomberg, Bank of Singapore.
In 1994, both UST and US equities also sold off in tandem. Reviewing these two episodes can help to isolate the conditions that drove both stocks and bonds lower.
1994 and 2022: Aggressive monetary tightening sparked selloffs in bonds, spilling over to stocks
The “Great Bond Massacre” of 1994 is one of the most significant events in bond market history, wiping out over USD1t in global bond values. While historic at the time, the magnitude of losses was significantly surpassed by the bond rout of 2022 (see Exhibit 3). In both cases, the sharp and unexpected tightening of monetary policy by the US Federal Reserve (Fed) served as the trigger.[1]
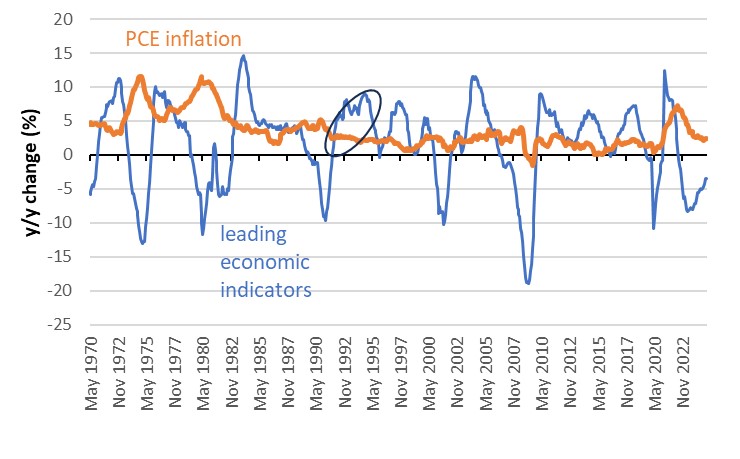
Exhibit 4: US leading economic indicator index and PCE deflation YoY change (monthly,1973-2024)
Source: Bank of Singapore using https://www.conference-board.org/topics/us-leading-indicators and Bloomberg data.
At the beginning of 1994, the Fed, under Chairman Alan Greenspan, initiated a series of interest rate hikes to avert any potential upsurge in inflation arising from a robustly growing US economy (illustrated in Exhibit 4 by steady gains in US leading economic indicators) through 1993. Inflation had been trending lower since the early 1980s and remained well behaved, and the Fed was eager to consolidate these gains.
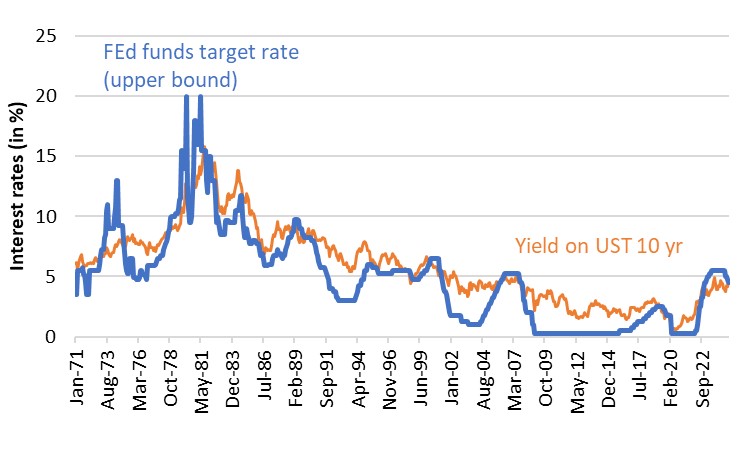
The Fed increased the federal funds rate by 25bps in Feb 1994, marking the first rate hike since 1989. Over the course of the year, the Fed raised rates six more times, totaling 300bps (see exhibit 5). The rate hikes took investors by surprise, particularly considering such well-behaved inflation. Bond prices fell sharply as yields spiked higher.
Exhibit 5: 10Y UST yield and Fed funds rates (monthly,1973-2024)
Source: Bloomberg, Bank of Singapore.
In 2022, the Fed commenced tightening cycle, at an unprecedented pace that again shocked the market. Unlike 1994, the catalyst was an exceptional surge in inflation. After several decades of relatively low and stable inflation, in 2021 the US experienced a sharp spike in the pace of price increases. The annual inflation rate, as measured by the PCE deflator, registered at 1.8% in Feb 2021, and continued rising through the next 18 months, peaking at 7.2% in Jun 2022, its highest level since 1981. Inflation surged due to a combination of factors, including pandemic-related supply chain disruptions, alongside fiscal and monetary stimulus which put upward pressure on wages and prices. Rising prices of food and energy added meaningfully to inflation.[2]
The Fed responded with one of the most aggressive tightening cycles in its history. The federal funds rate increased from near zero in Mar 2022 to over 4% by the end of the year, a total change of 425bps in just nine months. 10Y US rates rose nearly in lockstep. 2022 marked one of the worst years ever for bonds. The Bloomberg US Aggregate Bond Index fell by about 13%, its largest annual decline since its inception in 1976. Long-duration bonds were particularly hard hit, as their prices are highly sensitive to interest rate changes. Some long-dated UST bonds lost over 20-30% in value.
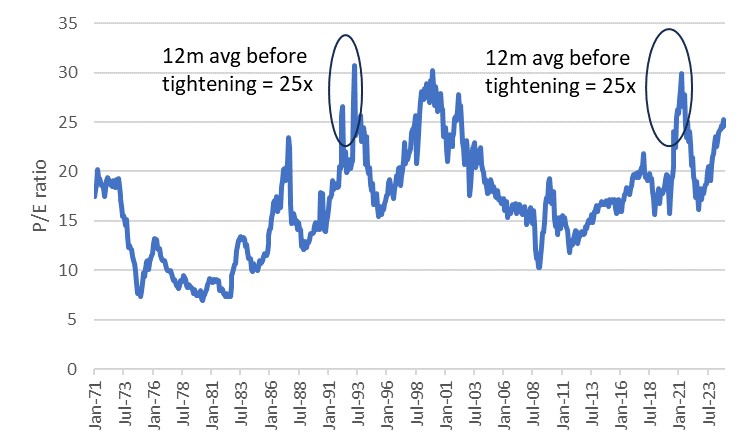
In both 1994 and 2022, the bond market rout spilled over into the US equity market, which started each tightening cycle at lofty valuations (see Exhibit 6), around the highest ranges on record.
Exhibit 6: S&P 500 Index P/E ratio (monthly,1973-2024)
Source: Bloomberg, Bank of Singapore.
Besides equities’ high starting valuations, rising interest rates dampened their comparable attractiveness to bonds. Exhibit 7 illustrates the S&P 500 Index earnings yield (equal to the inverse of the P/E ratio), 10Y UST yields, and their difference. This difference was bouncing around historically negative levels going into the unexpected hiking cycle in 1994, reflecting the relative dearness of stocks vs bonds, which rendered equities precariously sensitive to the sharp spike in bond yields.
Exhibit 7: S&P 500 Index earnings yield – 10Y US yield (monthly,1973-2024)

Source: Bloomberg, Bank of Singapore.
In 2022, equity earnings yields were comfortably well above bond yields. But as bond yields rose, they began to offer a more compelling investment option, triggering some rotation out of stocks to lock in higher rates in fixed income markets. The S&P 500 Index fell nearly 20% in 2022, marking its worst annual performance since 2008. The Nasdaq Composite Index, heavily weighted toward tech stocks (arguably more reliant on long-term earnings being discounted at higher rates), dropped by more than 30%.
In both 1994 and 2022, the sharp tightening in Fed policy precipitated bond market volatility and yield spikes which drove equity markets lower. If Fed tightening during these episodes resulted in poor performance across bonds and stocks, why didn’t this occur during the other instances of monetary tightening?
Why bonds and stocks sold off during the 1994 and 2022 monetary tightening episodes but not during others
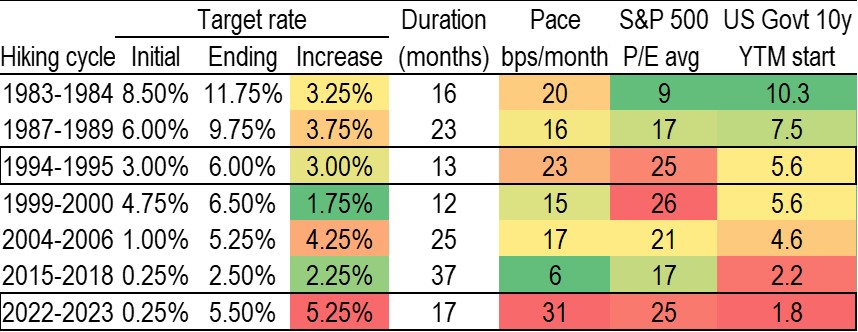
There have been seven full tightening periods since the Fed began targeting the federal funds rate as a policy lever in 1982.[3] Exhibit 8 summarises key characteristics across all seven episodes, and underscores 1994 and 2022. What these two instances have in common are (1) a rapid pace of tightening (25bps and higher a month), and elevated average equity valuations in the 12m preceding the initial tightening. Additionally, the low starting bond yield in 2022 made bonds particularly susceptible to a selloff arising from the sharp withdrawal of central bank liquidity: there was less of an income cushion to blunt the impact from falling prices. Returning to Exhibit 3, the rolling 12m bond total returns (income + price change) were a quantum more negative than the comparably modest negative bond returns in 1994.
Exhibit 8: Summary of key characteristics of Fed tightening cycles (1982-2024)
Source: Bloomberg, Bank of Singapore.
Implications for investors
Over the relatively short (12m) horizon that has been the focus of this analysis, investors may need to assess the reliability of traditional 60-40 portfolios as bonds may not offset equity losses under certain circumstances: rapid monetary policy tightening, elevated equity valuations and low bond yields can signal increased risk of bonds disappointing as a hedge. However, with US yields having moved meaningfully higher (by a few hundred bps!) since 2022, a significant yield buffer has been established to help mitigate any potential bond losses.
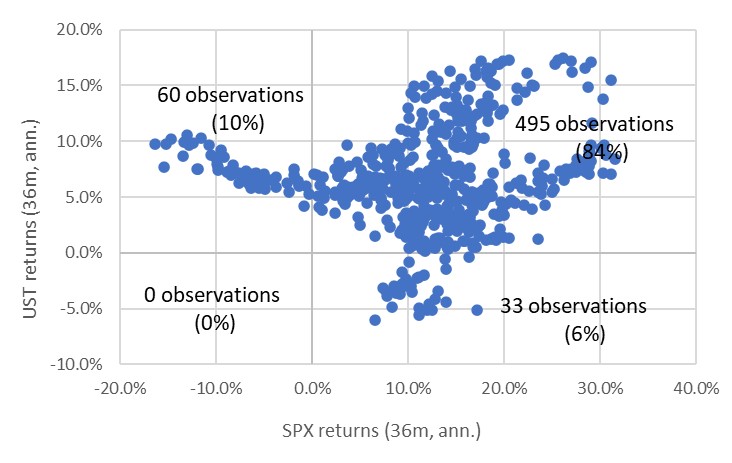
Exhibit 9: Scatter plot of rolling 36m returns (annualized): SPX and UST (monthly,1973-2024)
Source: Bloomberg, Bank of Singapore.
Moreover, if investors have horizons greater than 12m, history shows that bonds have fulfilled their hedging function: negative equity returns over three years, for example, have consistently corresponded with positive performance in bonds (see exhibit 10). Moreover, over a rolling 3y period, very rarely are bond returns negative (represented by the few observations below the horizontal axis): this is because over longer periods, income drives a more notable portion of bond total performance than price returns.
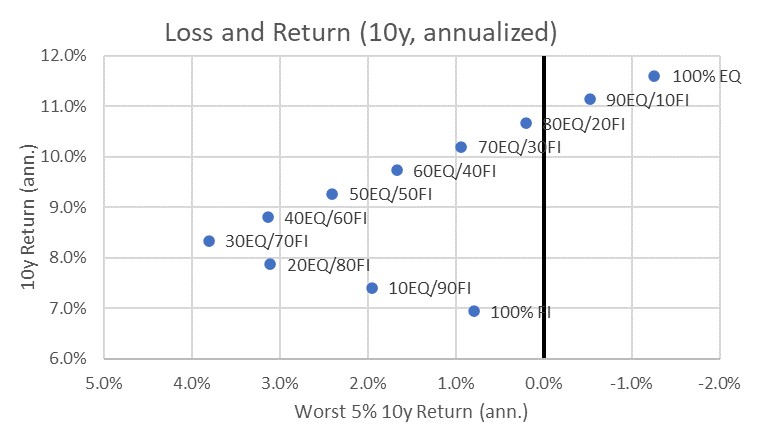
Over even longer horizons (10 years, which is the suitable term for a strategic allocation), bonds contribute meaningfully to averting portfolio drawdowns. Exhibit 10 illustrates combinations of equity/bond portfolios, their average 10Y return since 1973 (y-axis) and the worst 5% of their 10Y returns (x-axis). A portfolio invested 100% in equities posted an average decadal return of just under 12% since 1973, but with the worst 5% losing 1% annualised over a decade. Diversifying 20% into bonds reduces tail risk of loss, with a 100bps cost to annual performance. Risk preferences of investors will determine where they reside in the continuum of balancing tail risk of loss with reward.
Exhibit 10: Sample portfolio worst performance vs average returns (10Y returns annualized, Jan 1973 – Dec 2024)
Source: Bloomberg, Bank of Singapore.
Summary
Appendix: Summary of S&P 500 Index drawdowns
Source: Bloomberg, Bank of Singapore.
[1] See https://www.bis.org/publ/work32.pdf
[2] See What Caused the US Pandemic-Era Inflation?
Olivier J. Blanchard & Ben S. Bernanke summarized in https://www.nber.org/digest/20239/unpacking-causes-pandemic-era-inflation-us.
[3] See When Did the FOMC Begin Targeting the Federal Funds Rate? What the Verbatim Transcripts Tell Us
FRB of St. Louis Working Paper No. 2004-015B found in https://papers.ssrn.com/sol3/papers.cfm?abstract_id=760518
Disclaimers and Disclosures
This material is prepared by Bank of Singapore Limited (Co Reg. No.: 197700866R) (the “Bank”) and is distributed in Singapore by the Bank.
This material does not provide individually tailored investment advice. This material has been prepared for and is intended for general circulation. The contents of this material does not take into account the specific investment objectives, investment experience, financial situation, or particular needs of any particular person. You should independently evaluate the contents of this material, and consider the suitability of any product discussed in this material, taking into account your own specific investment objectives, investment experience, financial situation and particular needs. If in doubt about the contents of this material or the suitability of any product discussed in this material, you should obtain independent financial advice from your own financial or other professional advisers, taking into account your specific investment objectives, investment experience, financial situation and particular needs, before making a commitment to purchase any product.
The Bank shall not be responsible or liable for any loss (whether direct, indirect or consequential) that may arise from, or in connection with, any use of or reliance on any information contained in or derived from this material, or any omission from this material, other than where such loss is caused solely by the Bank’s wilful default or gross negligence.
This material is not and should not be construed, by itself, as an offer or a solicitation to deal in any product or to enter into any legal relations. You should contact your own licensed representative directly if you are interested in buying or selling any product discussed in this material.
This material is not intended for distribution, publication or use by any person in any jurisdiction outside Singapore, Hong Kong or such other jurisdiction as the Bank may determine in its absolute discretion, where such distribution, publication or use would be contrary to applicable law or would subject the Bank or its related corporations, connected persons, associated persons or affiliates (collectively “Affiliates”) to any licensing, registration or other requirements in such jurisdiction.
The Bank and its Affiliates may have issued other reports, analyses, or other documents expressing views different from the contents of this material, and may provide other advice or make investment decisions that are contrary to the views expressed in this material, and all views expressed in all reports, analyses and documents are subject to change without notice. The Bank and its Affiliates reserve the right to act upon or use the contents of this material at any time, including before its publication.
The author of this material may have discussed the information or views contained in this material with others within or outside the Bank, and the author or such other Bank employees may have already acted on the basis of such information or views (including communicating such information or views to other customers of the Bank).
The Bank, its employees (including those with whom the author may have consulted in the preparation of this material))and discretionary accounts managed by the Bank may have long or short positions (including positions that may be different from or opposing to the views in this material or may be otherwise interested in any of the product(s) (including derivatives thereof) discussed in material, may have acquired such positions at prices and market conditions that are no longer available, may from time to time deal in such product(s) and may have interests different from or adverse to your interests.
Analyst Declaration
The analyst(s) who prepared this material certifies that the opinions contained herein accurately and exclusively reflect his or her views about the securities of the company(ies) and that he or she has taken reasonable care to maintain independence and objectivity in respect of the opinions herein.
The analyst(s) who prepared this material and his/her associates [have / do not] have financial interests in the company(ies). Financial interests refer to investments in securities, warrants and/or other derivatives. The analyst(s) receives compensation based on the overall revenues of Bank of Singapore Limited, and no part of his or her compensation was, is, or will be directly or indirectly related to the inclusion of specific recommendations or views in this material. The reporting line of the analyst(s) is separate from and independent of the business solicitation or marketing departments of Bank of Singapore Limited.
The analyst(s) and his/her associates confirm that they do not serve as directors or officers of the company(ies) and the company(ies)or other third parties have not provided or agreed to provide any compensation or other benefits to the analyst(s) in connection with this material.
An “associate” is defined as (i) the spouse, parent or step-parent, or any minor child (natural or adopted) or minor step-child, or any sibling or step-sibling of the analyst; (ii) the trustee of a trust of which the analyst, his spouse, parent or step-parent, minor child (natural or adopted) or minor step-child, or sibling or step-sibling is a beneficiary or discretionary object; or (iii) another person accustomed or obliged to act in accordance with the directions or instructions of the analyst.
Conflict of Interest Declaration
The Bank is a licensed bank regulated by the Monetary Authority of Singapore in Singapore. Bank of Singapore Limited, Hong Kong Branch (incorporated in Singapore with limited liability), is an Authorized Institution as defined in the Banking Ordinance of Hong Kong (Cap 155), regulated by the Hong Kong Monetary Authority in Hong Kong and a Registered Institution as defined in the Securities and Futures Ordinance of Hong Kong (Cap.571) regulated by the Securities and Futures Commission in Hong Kong. The Bank, its employees and discretionary accounts managed by its Singapore Office/Hong Kong Office may have long or short positions or may be otherwise interested in any of the investment products (including derivatives thereof) referred to in this document and may from time to time dispose of any such investment products. The Bank forms part of the OCBC Group (being for this purpose Oversea-Chinese Banking Corporation Limited (“OCBC Bank”) and its subsidiaries, related and affiliated companies). OCBC Group, their respective directors and/or employees (collectively “Related Persons”) may have interests in the investment products or the issuers mentioned herein. Such interests include effecting transactions in such investment products, and providing broking, investment banking and other financial services to such issuers. OCBC Group and its Related Persons may also be related to, and receive fees from, providers of such investment products. There may be conflicts of interest between OCBC Bank, the Bank, OCBC Investment Research Private Limited, OCBC Securities Private Limited or other members of the OCBC Group and any of the persons or entities mentioned in this report of which the Bank and its analyst(s) are not aware due to OCBC Bank’s Chinese Wall arrangement.
The Bank adheres to a group policy (as revised and updated from time to time) that provides how entities in the OCBC Group manage or eliminate any actual or potential conflicts of interest which may impact the impartiality of research reports issued by any research analyst in the OCBC Group.
Other Disclosures
Singapore
Where this material relates to structured deposits, this clause applies:
The product is a structured deposit. Structured deposits are not insured by the Singapore Deposit Insurance Corporation. Unlike traditional deposits, structured deposits have an investment element and returns may vary. You may wish to seek independent advice from a financial adviser before making a commitment to purchase this product. In the event that you choose not to seek independent advice from a financial adviser, you should carefully consider whether this product is suitable for you.
Where this material relates to dual currency investments, this clause applies:
The product is a dual currency investment. A dual currency investment product (“DCI”) is a derivative product or structured product with derivatives embedded in it. A DCI involves a currency option which confers on the deposit-taking institution the right to repay the principal sum at maturity in either the base or alternate currency. Part or all of the interest earned on this investment represents the premium on this option.
By purchasing this DCI, you are giving the issuer of this product the right to repay you at a future date in an alternate currency that is different from the currency in which your initial investment was made, regardless of whether you wish to be repaid in this currency at that time. DCIs are subject to foreign exchange fluctuations which may affect the return of your investment. Exchange controls may also be applicable to the currencies your investment is linked to. You may incur a loss on your principal sum in comparison with the base amount initially invested. You may wish to seek advice from a financial adviser before making a commitment to purchase this product. In the event that you choose not to seek advice from a financial adviser, you should carefully consider whether this product is suitable for you.
Hong Kong
This material has not been delivered for registration to the Registrar of Companies in Hong Kong and its contents have not been reviewed by any regulatory authority in Hong Kong. Accordingly: (i) the shares/notes may not be offered or sold in Hong Kong by means of any document other than to persons who are "Professional Investors" within the meaning of the Securities and Futures Ordinance (Cap. 571) of Hong Kong and the Securities and Futures (Professional Investor) Rules made thereunder or in other circumstances which do not result in the document being a "prospectus" within the meaning of the Companies (Winding Up and Miscellaneous Provisions) Ordinance (Cap. 32) of Hong Kong or which do not constitute an offer to the public within the meaning of the Companies (Winding Up and Miscellaneous Provisions) Ordinance; and (ii) no person may issue any invitation, advertisement or other material relating to the shares/notes whether in Hong Kong or elsewhere, which is directed at, or the contents of which are likely to be accessed or read by, the public in Hong Kong (except if permitted to do so under the securities laws of Hong Kong) other than with respect to the shares/notes which are or are intended to be disposed of only to persons outside Hong Kong or only to "Professional Investors" within the meaning of the Securities and Futures Ordinance and the Securities and Futures (Professional Investor) Rules made thereunder.
Where this material involves derivatives, do not invest in it unless you fully understand and are willing to assume the risks associated with it. If you have any doubt, you should seek independent professional financial, tax and/or legal advice as you deem necessary.
Where this material relates to a Complex Product, this clause applies:
Warning Statement and Information about Complex Product
(Applicable to accounts managed by Hong Kong Relationship Manager)
Where this material relates to a Complex Product – funds and ETFs, this clause applies additionally:
Where this material relates to a Complex Product (Options and its variants, Swap and its variants, Accumulator and its variants, Reverse Accumulator and its variants, Forwards), this clause applies additionally:
Where this material relates to a Loss Absorption Product, this clause applies:
Warning Statement and Information about Loss Absorption Products
(Applicable to accounts managed by Hong Kong Relationship Manager)
Before you invest in any Loss Absorption Product (as defined by the Hong Kong Monetary Authority), please read and ensure that you understand the features of a Loss Absorption Product, which may generally have the following features:
Where this material relates to a certificate of deposit, this clause applies:
It is not a protected deposit and is not protected by the Deposit Protection Scheme in Hong Kong.
Where this material relates to a structured deposit, this clause applies:
It is not a protected deposit and is not protected by the Deposit Protection Scheme in Hong Kong.
Where this material relates to a structured product, this clause applies:
This is a structured product which involves derivatives. Do not invest in it unless you fully understand and are willing to assume the risks associated with it. If you are in any doubt about the risks involved in the product, you may clarify with the intermediary or seek independent professional advice.
Dubai International Financial Center
Where this material relates to structured products and bonds, this clause applies:
The Distributor represents and agrees that it has not offered and will not offer the product to any person in the Dubai International Financial Centre unless such offer is an “Exempt Offer” in accordance with the Market Rules of the Dubai Financial Services Authority (the “DFSA”).
The DFSA has no responsibility for reviewing or verifying any documents in connection with Exempt Offers.
The DFSA has not approved the Information Memorandum or taken steps to verify the information set out in it, and has no responsibility for it.
The product to which this document relates may be illiquid and/or subject to restrictions in respect of their resale. Prospective purchasers of the products offered should conduct their own due diligence on the products.
Please make sure that you understand the contents of the relevant offering documents (including but not limited to the Information Memorandum or Offering Circular) and the terms set out in this document. If you do not understand the contents of the relevant offering documents and the terms set out in this document, you should consult an authorised financial adviser as you deem necessary, before you decide whether or not to invest.
Where this material relates to a fund, this clause applies:
This Fund is not subject to any form of regulation or approval by the Dubai Financial Services Authority (“DFSA”). The DFSA has no responsibility for reviewing or verifying any Prospectus or other documents in connection with this Fund. Accordingly, the DFSA has not approved the Prospectus or any other associated documents nor taken any steps to verify the information set out in the Prospectus, and has no responsibility for it. The Units to which this Fund relates may be illiquid and/or subject to restrictions on their resale. Prospective purchasers should conduct their own due diligence on the Units. If you do not understand the contents of this document you should consult an authorized financial adviser. Please note that this offer is intended for only Professional Clients and is not directed at Retail Clients.
These are also available for inspection, during normal business hours, at the following location:
Bank of Singapore
Office 30-34 Level 28
Central Park Tower
DIFC, Dubai
U.A.E
BOS Wealth Management Europe S.A., UK Branch
BOS Wealth Management Europe S.A., UK Branch (BOSWME UK), is authorized and regulated by the Financial Conduct Authority (FCA) and is providing this material for informational purposes only. BOSWME UK does not endorse any specific investments or financial products mentioned in this material. BOSWME UK and its employees accept no liability for any loss or damage arising from the use of this material or reliance on its content.
This material is being distributed to and is directed only at persons in the UK who meet the requirements to be considered “Professional Clients” within the meaning of the Conduct of Business Sourcebook rules on client categorisation, part of the FCA Handbook (the “FCA Rules”) and is not intended for retail investors.
Any person in the UK who receives this material will be deemed to have represented and agreed that it can be considered a Professional Client. Any such recipient will also be deemed to have represented and agreed that it has not received this material on behalf of persons in the UK other than Professional Clients for whom the investor has authority to make decisions on a wholly discretionary basis. BOSWME UK will rely upon the truth and accuracy of the foregoing representations and agreements. Any person who is not a Professional Client should not act or rely on this material or any of their contents.
Investing in financial markets carries the risk of losing capital, and investors should be aware of and carefully consider this risk before making any investment decisions. The value of investments can fluctuate, and there is no guarantee that investors will recoup their initial investment. Past performance is not indicative of future results, and the performance of investments can be affected by various factors, including but not limited to market conditions, economic factors, and changes in regulations or tax laws. Forward-looking statements should not be considered as guarantees or predictions of future events. Investors should be prepared for the possibility of losing all or a portion of their invested capital. It is recommended that investors seek professional advice and conduct thorough research before making any investment decisions.
Cross Border Disclaimer and Disclosures
Refer to https://www.bankofsingapore.com/Disclaimers_and_Disclosures.html for cross-border marketing disclaimers and disclosures.
